Using SQL Lab
Using SQL Lab requires having at least one connected database. Here, you can explore your data using SQL queries.
Under SQL you will find the SQL Lab button.

Upon clicking it you will be taken to this interface
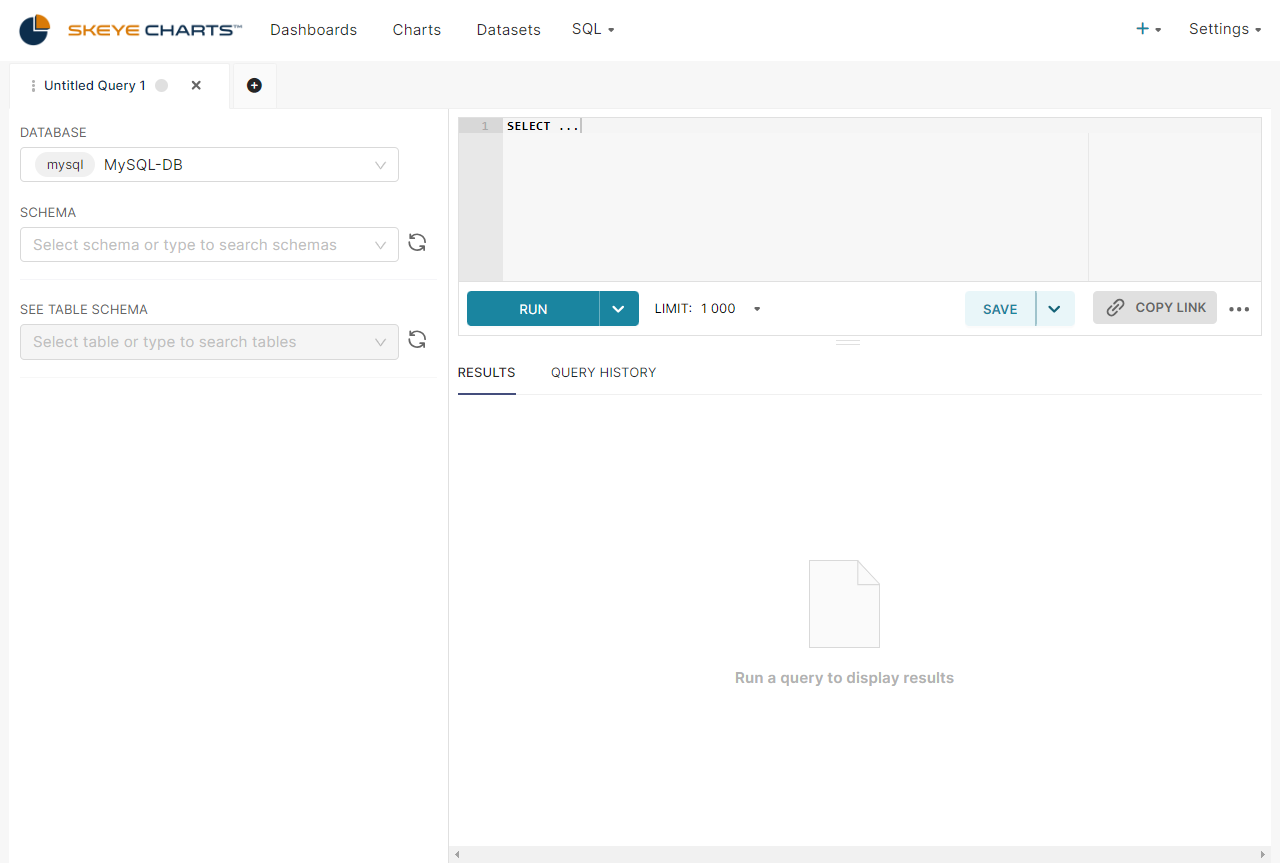
Let us break down the interface into sections first
- First section is the left part:
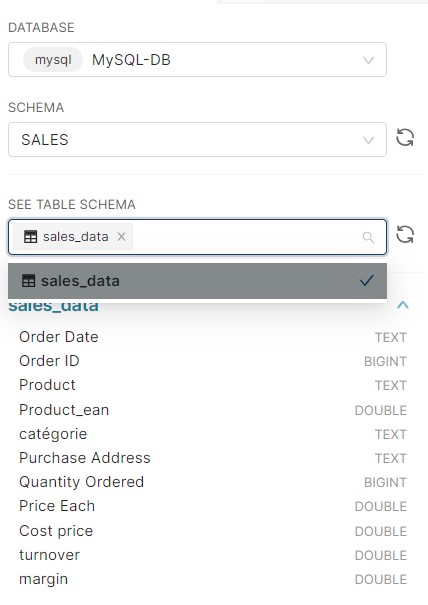
This section displays the connected databases, their schemas, and tables. Selecting a table will reveal its columns and datatypes.

Clicking the Copy SELECT statement to the clipboard will copy a statement similar to this
SELECT `Order Date`,
       `Order ID`,
       `Product`,
       `Product_ean`,
       `catégorie`,
       `Purchase Address`,
       `Quantity Ordered`,
       `Price Each`,
       `Cost price`,
       turnover,
       margin
FROM `SALES`.sales_data
LIMIT 100
which can then be used in the next section.
- Second section on the top right:
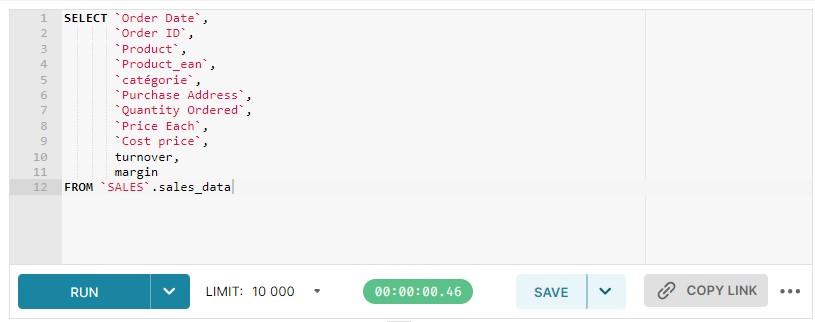
This is the section where you can write SQL queries to be executed, clicking the RUN button or Ctrl + Return on the keyboard to execute the query.
The Save button will save your query to be accessed from the SQL -> Saved Queries window
- Third section on the bottom right:
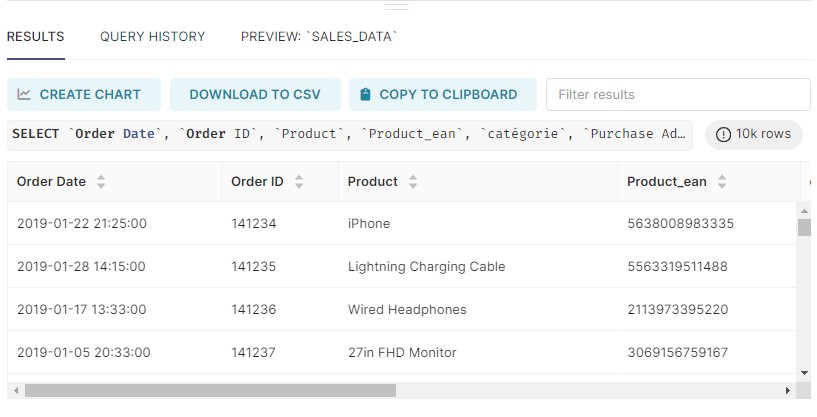
This section shows the results of the queries, from here you can CREATE CHART, DOWNLOAD TO CSV or COPY TO CLIPBOARD your results data.
Note that DML queries will be executed but not return any results if they were allowed on the database.
Phisical tables
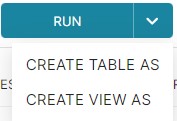
Clicking the ˅ arrow next to the RUN button will present you with the option to save the result as phisical table in the database, either as a view or a table
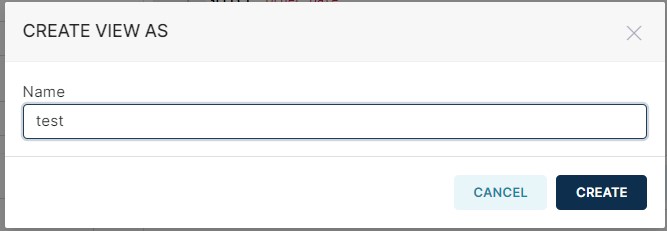
Clicking either one will show a popup where you can give a name to the table/view.
Virtual tables
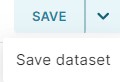
Clicking the ˅ arrow next to the Save button will present you with the option to save the result as a virtual table and a usable dataset in SkeyeCharts.
Upon clicking it, a popup window will appear, offering the option to save this as a new dataset or overwrite an existing one.
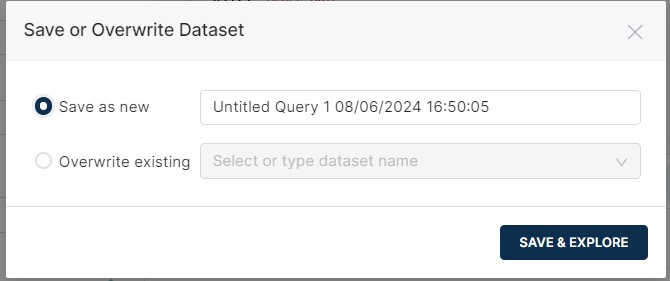
Clicking SAVE & EXPLORE will create the dataset and navigate you to the chart creation interface using that dataset.