Registering a new table
Now that you’ve configured a data source, you can select specific tables (called Datasets in Skeyecharts) that you want exposed in Skeyecharts for querying.
Navigate to Data and select the + Dataset button in the top right corner.

Select your Database, Schema, and Table using the drop downs that appear. In the following example, we register the sales_data table from a MySQL database.
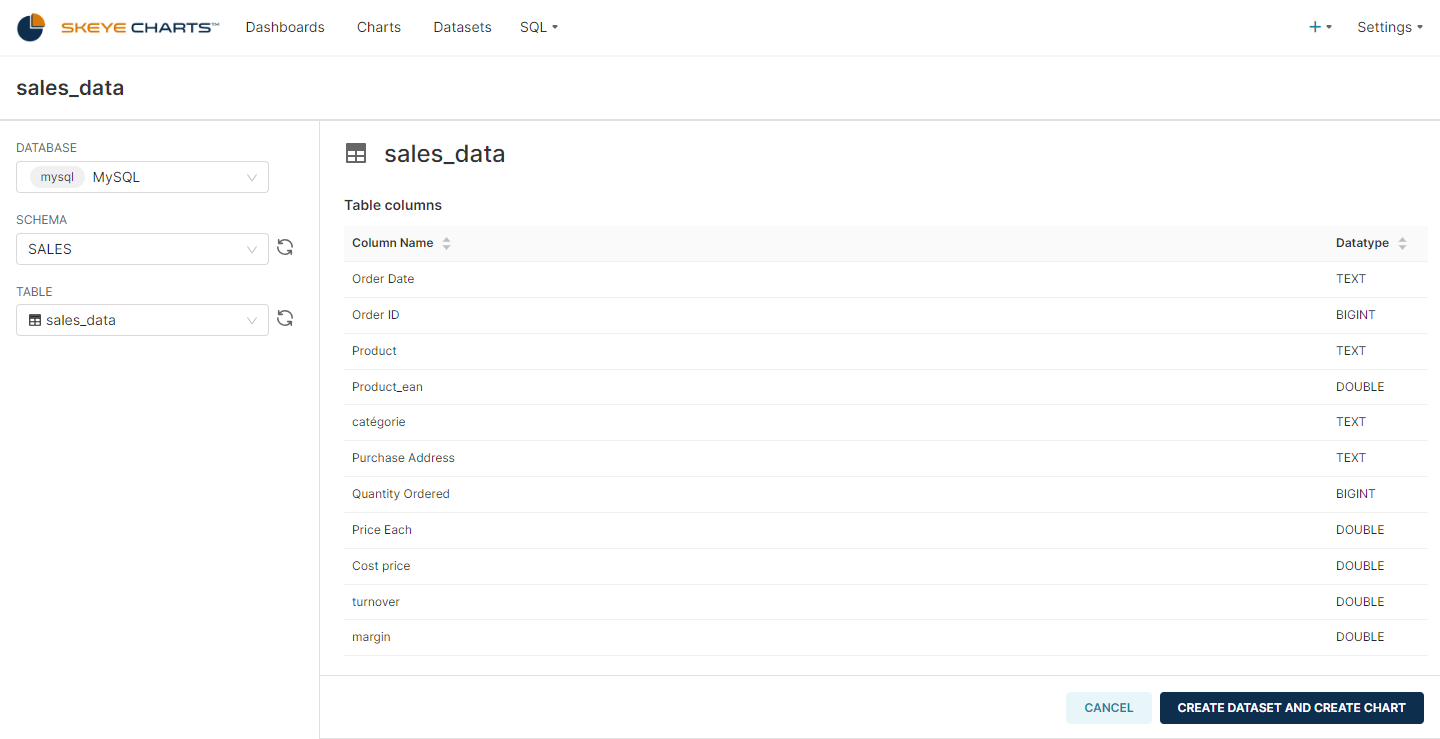
To finish, click the CREATE DATASET AND CREATE CHART button in the bottom right corner.
Your dataset should now be added in the list of datasets.
You will be then taken to create a chart using this dataset.
Customizing column properties
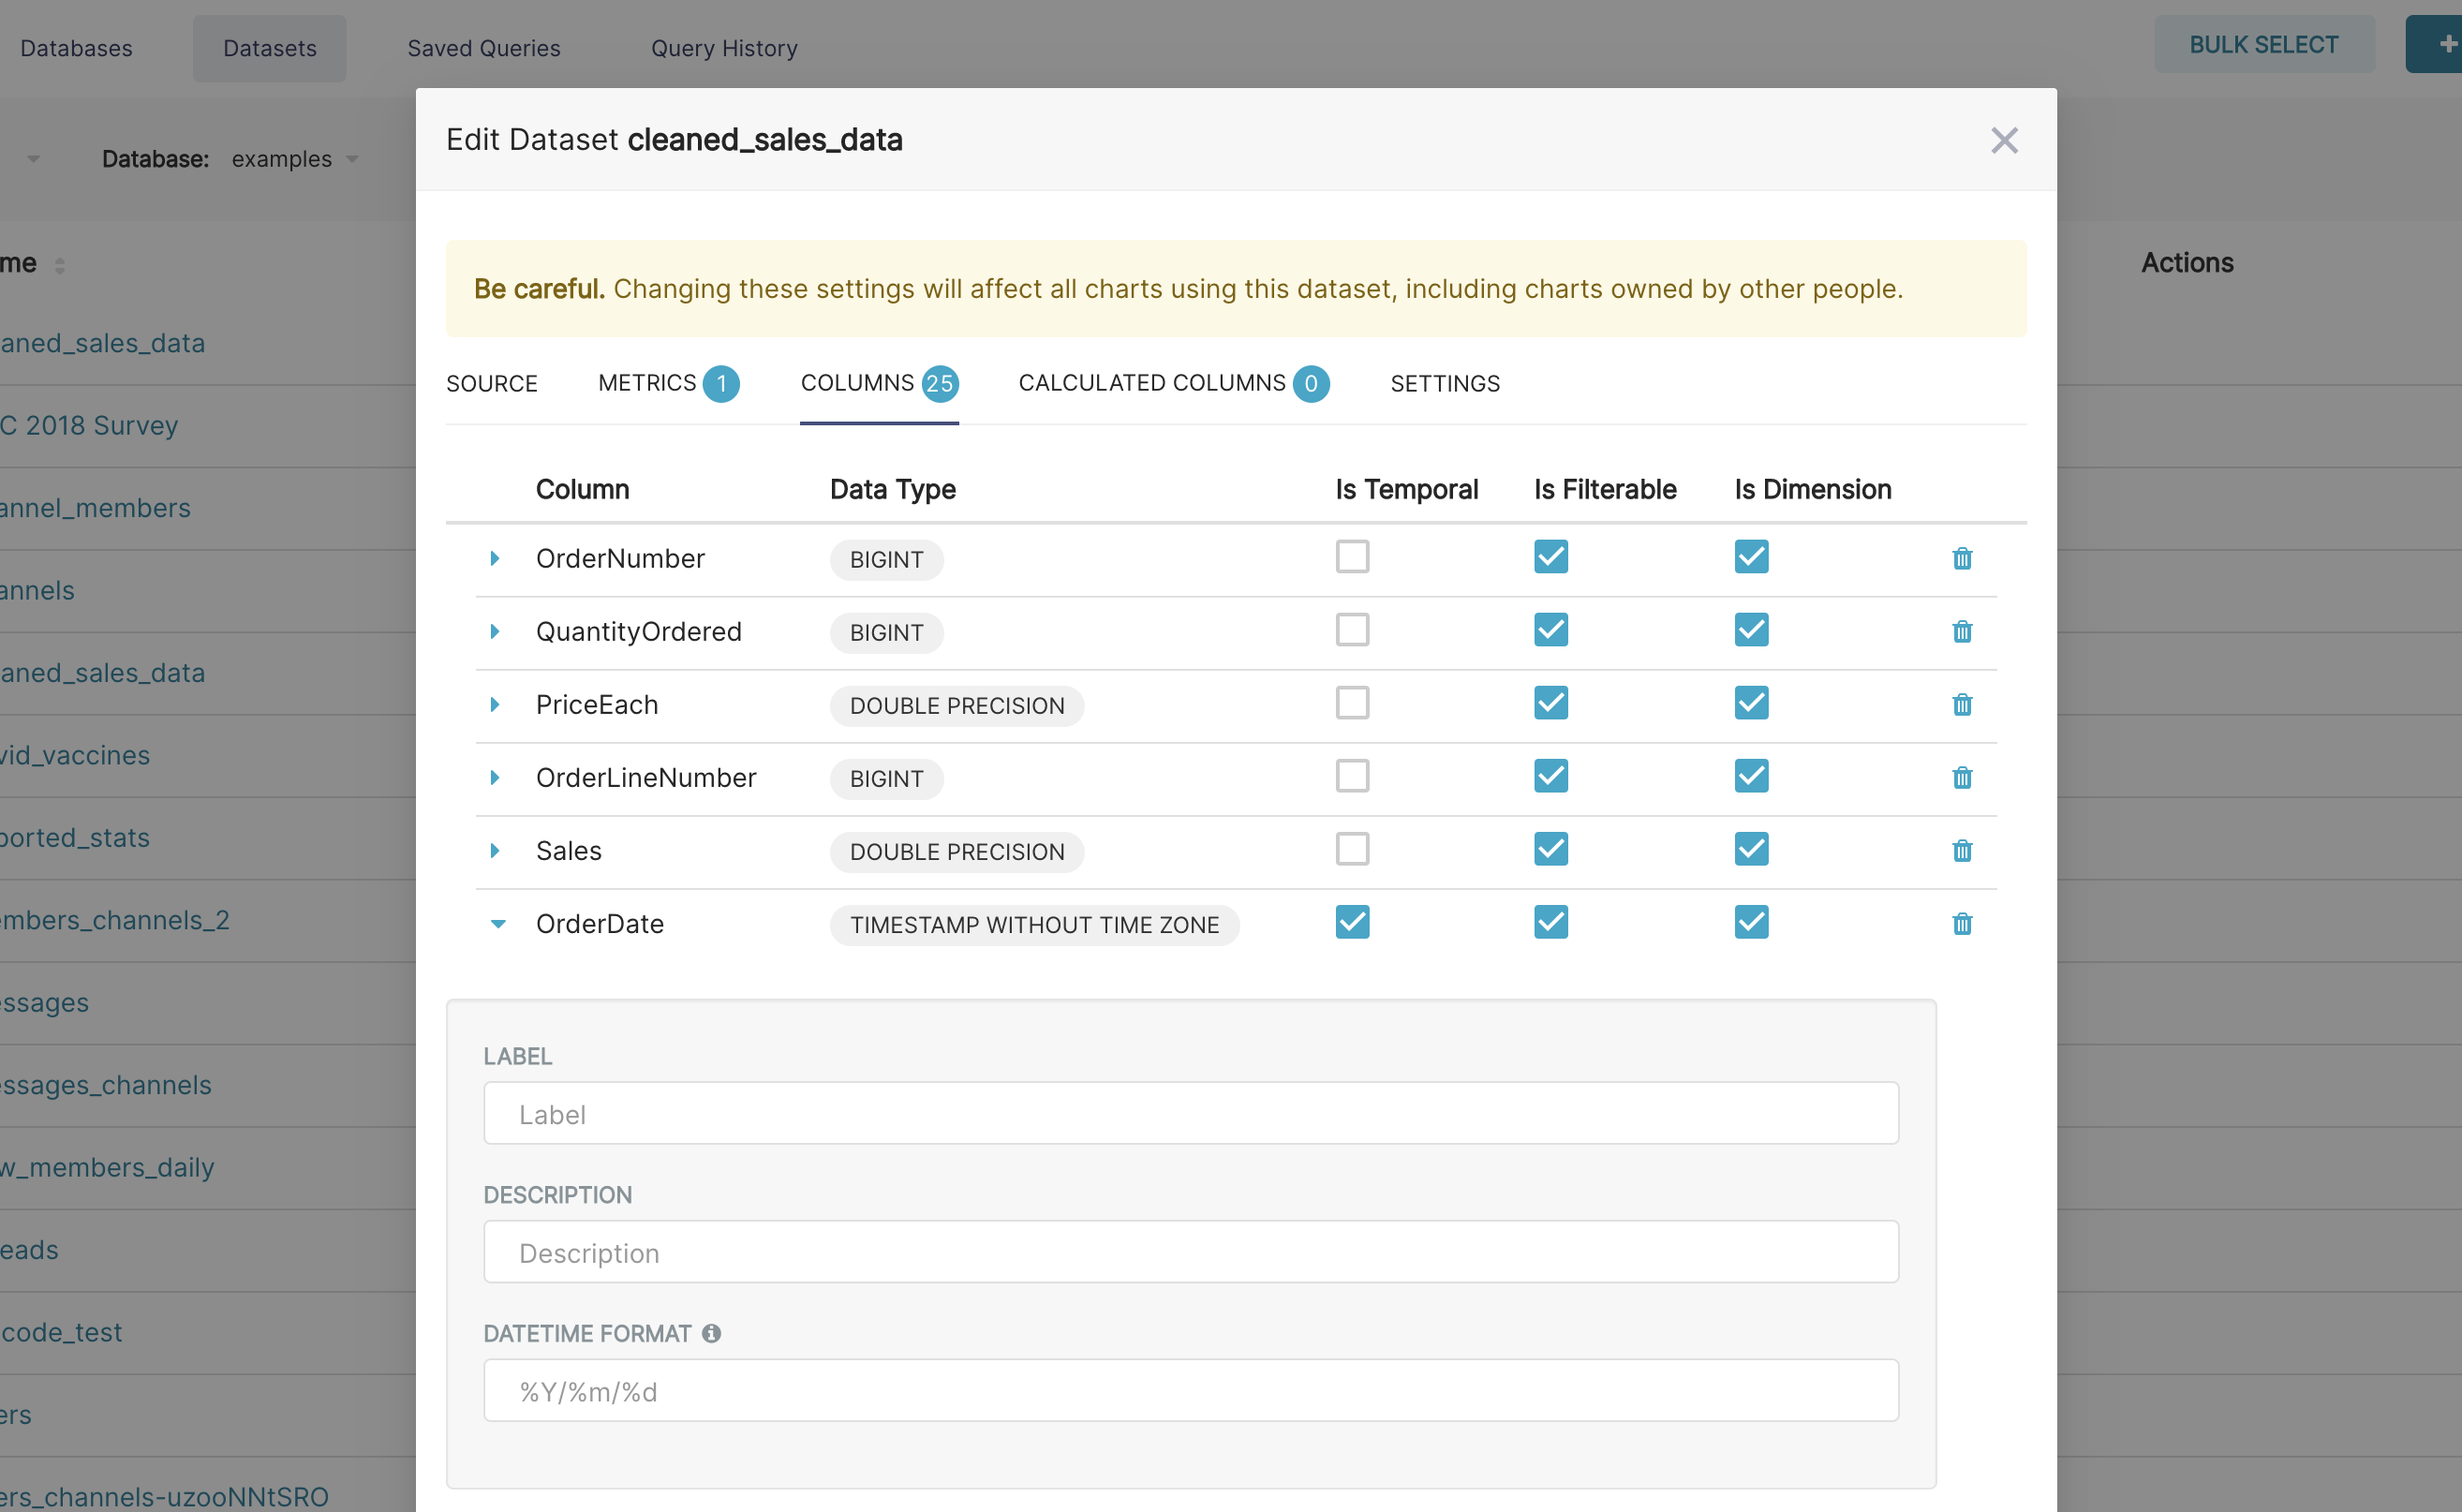
Now that you've registered your dataset, you can configure column properties for how the column should be treated in the Explore workflow
You first navigate to the Datasets section then click the edit icon :
- Is the column temporal? (should it be used for slicing & dicing in time series charts?)
- Should the column be filterable?
- Is the column dimensional?
- If it's a datetime column, how should Skeyecharts parse the datetime format? (using the ISO-8601 string pattern)
Skeyecharts semantic layer
Skeyecharts has a thin semantic layer that adds many quality of life improvements for analysts. The Skeyecharts semantic layer can store 2 types of computed data:
- Virtual metrics: you can write SQL queries that aggregate values
from multiple column (e.g.
SUM(recovered) / SUM(confirmed)) and make them available as columns for (e.g.recovery_rate) visualization in Explore. Aggregate functions are allowed and encouraged for metrics.
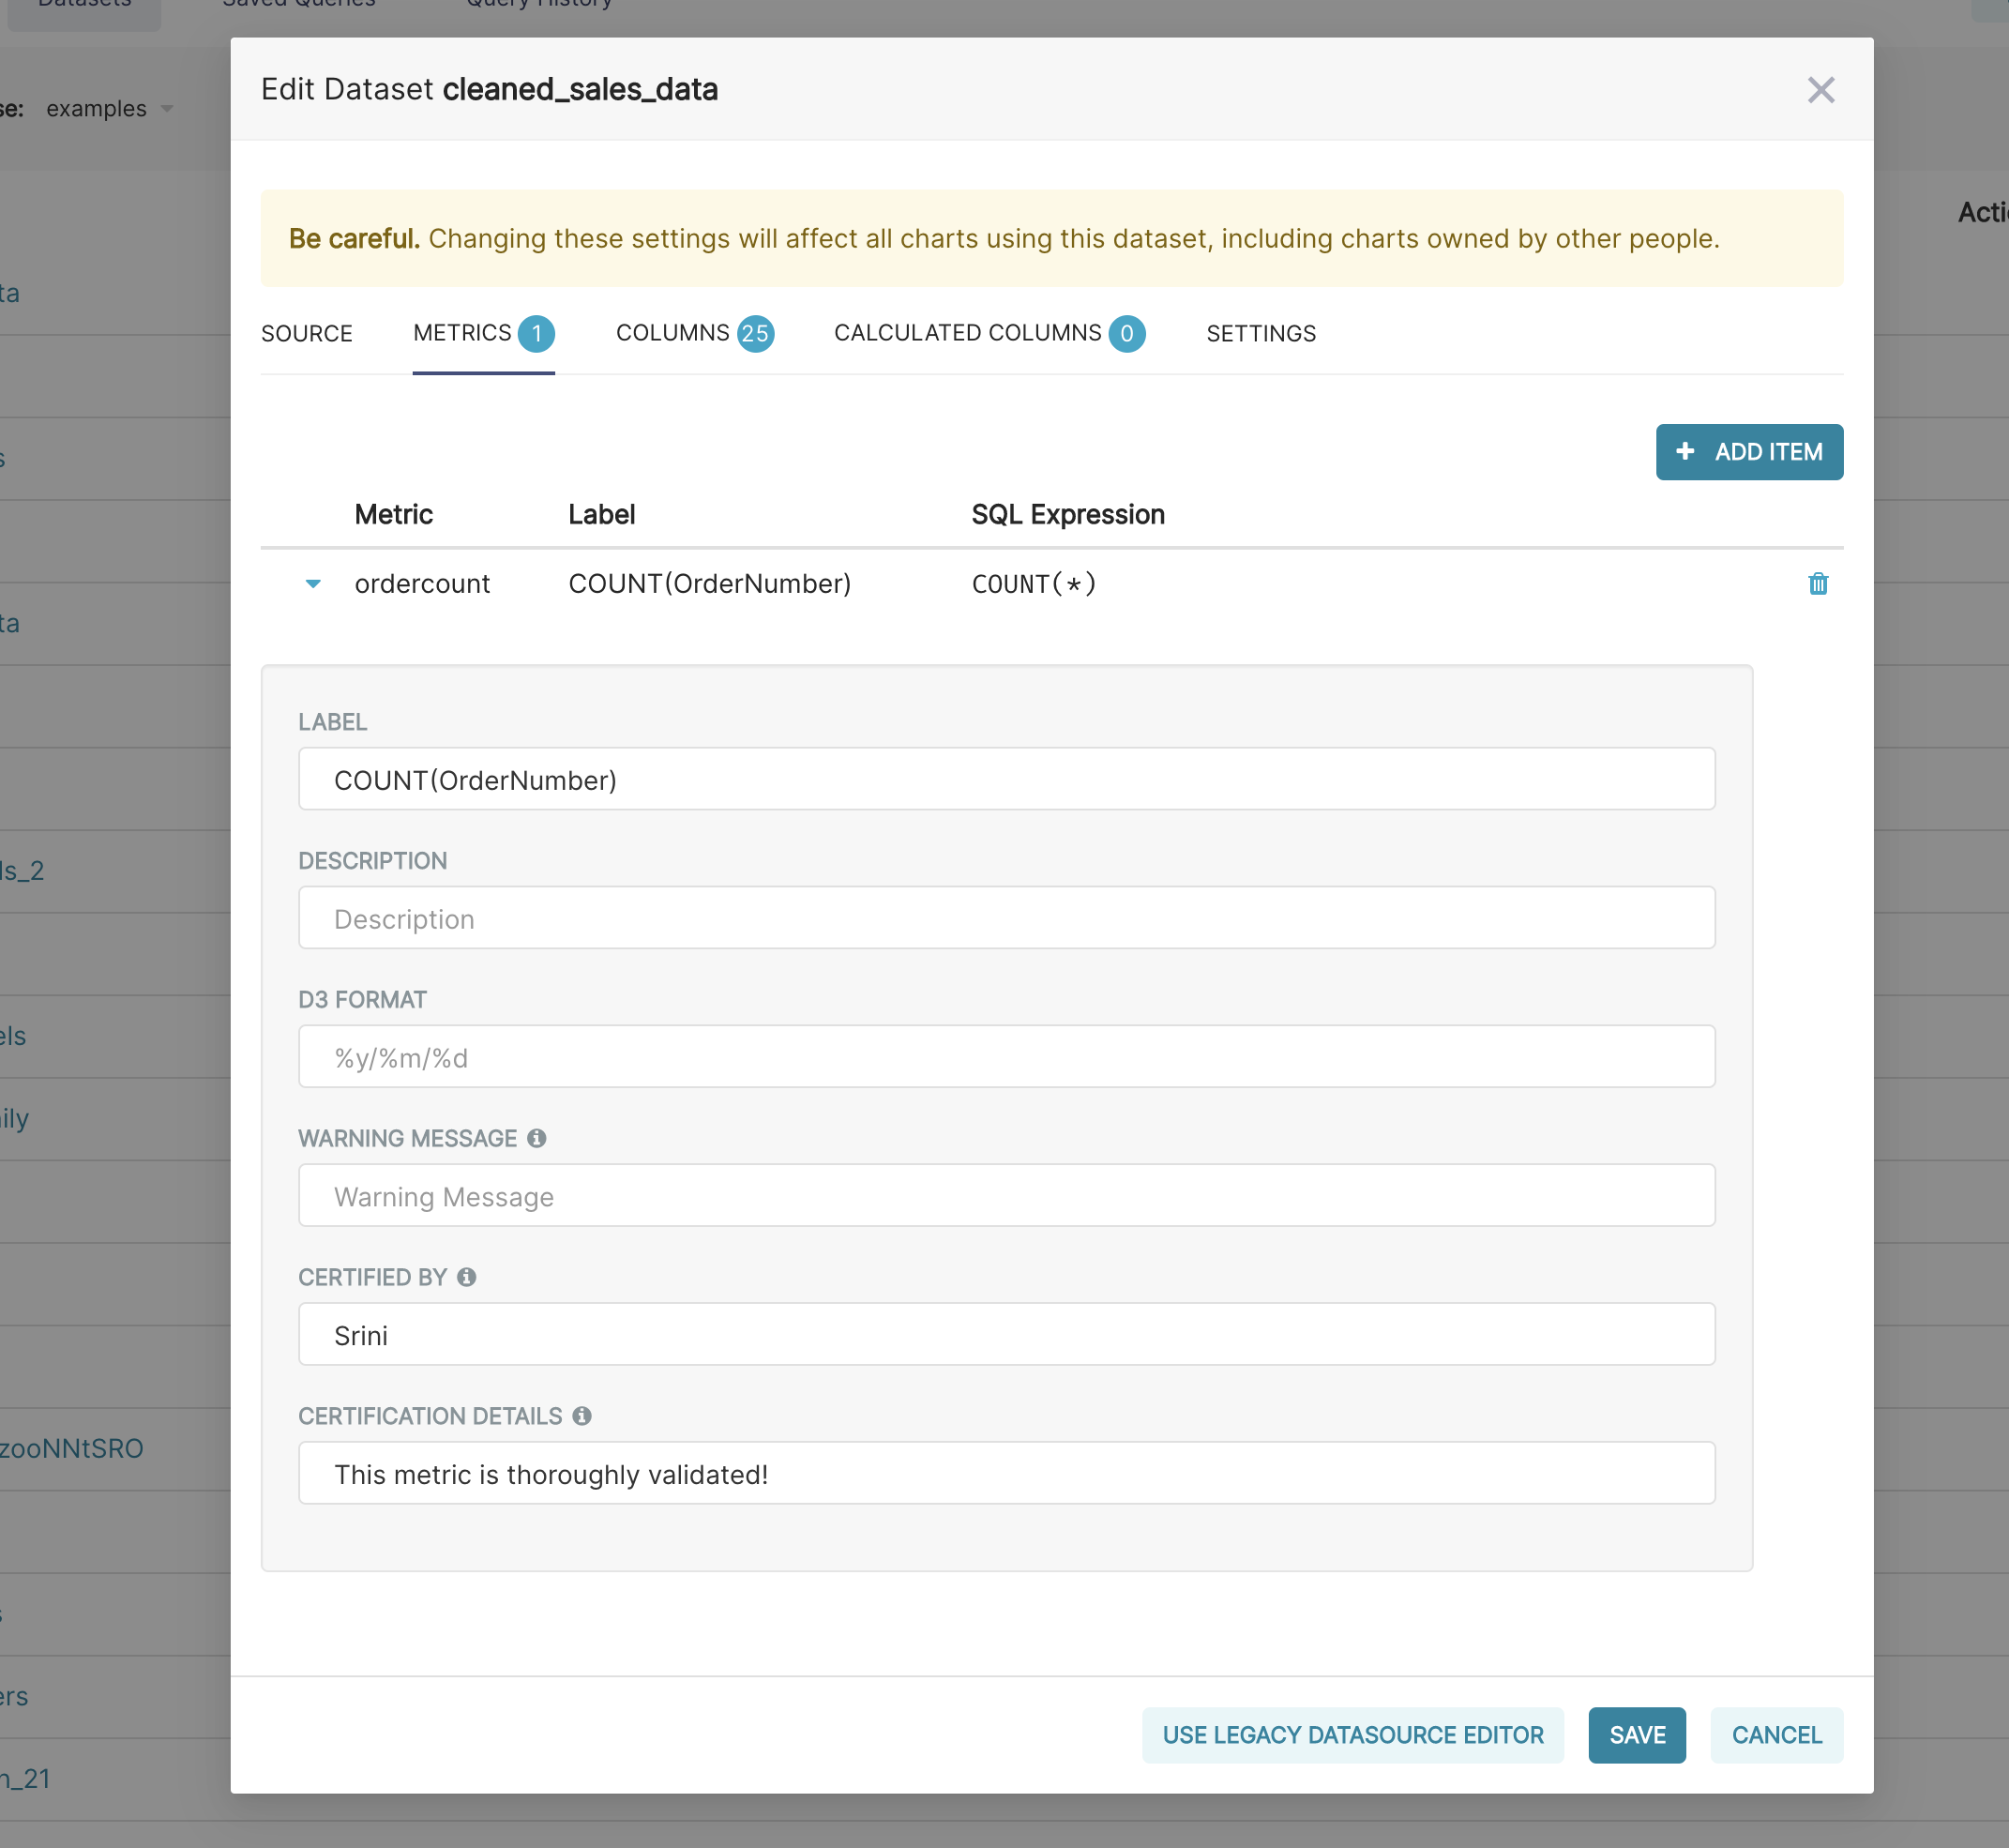
You can also certify metrics if you'd like for your team in this view.
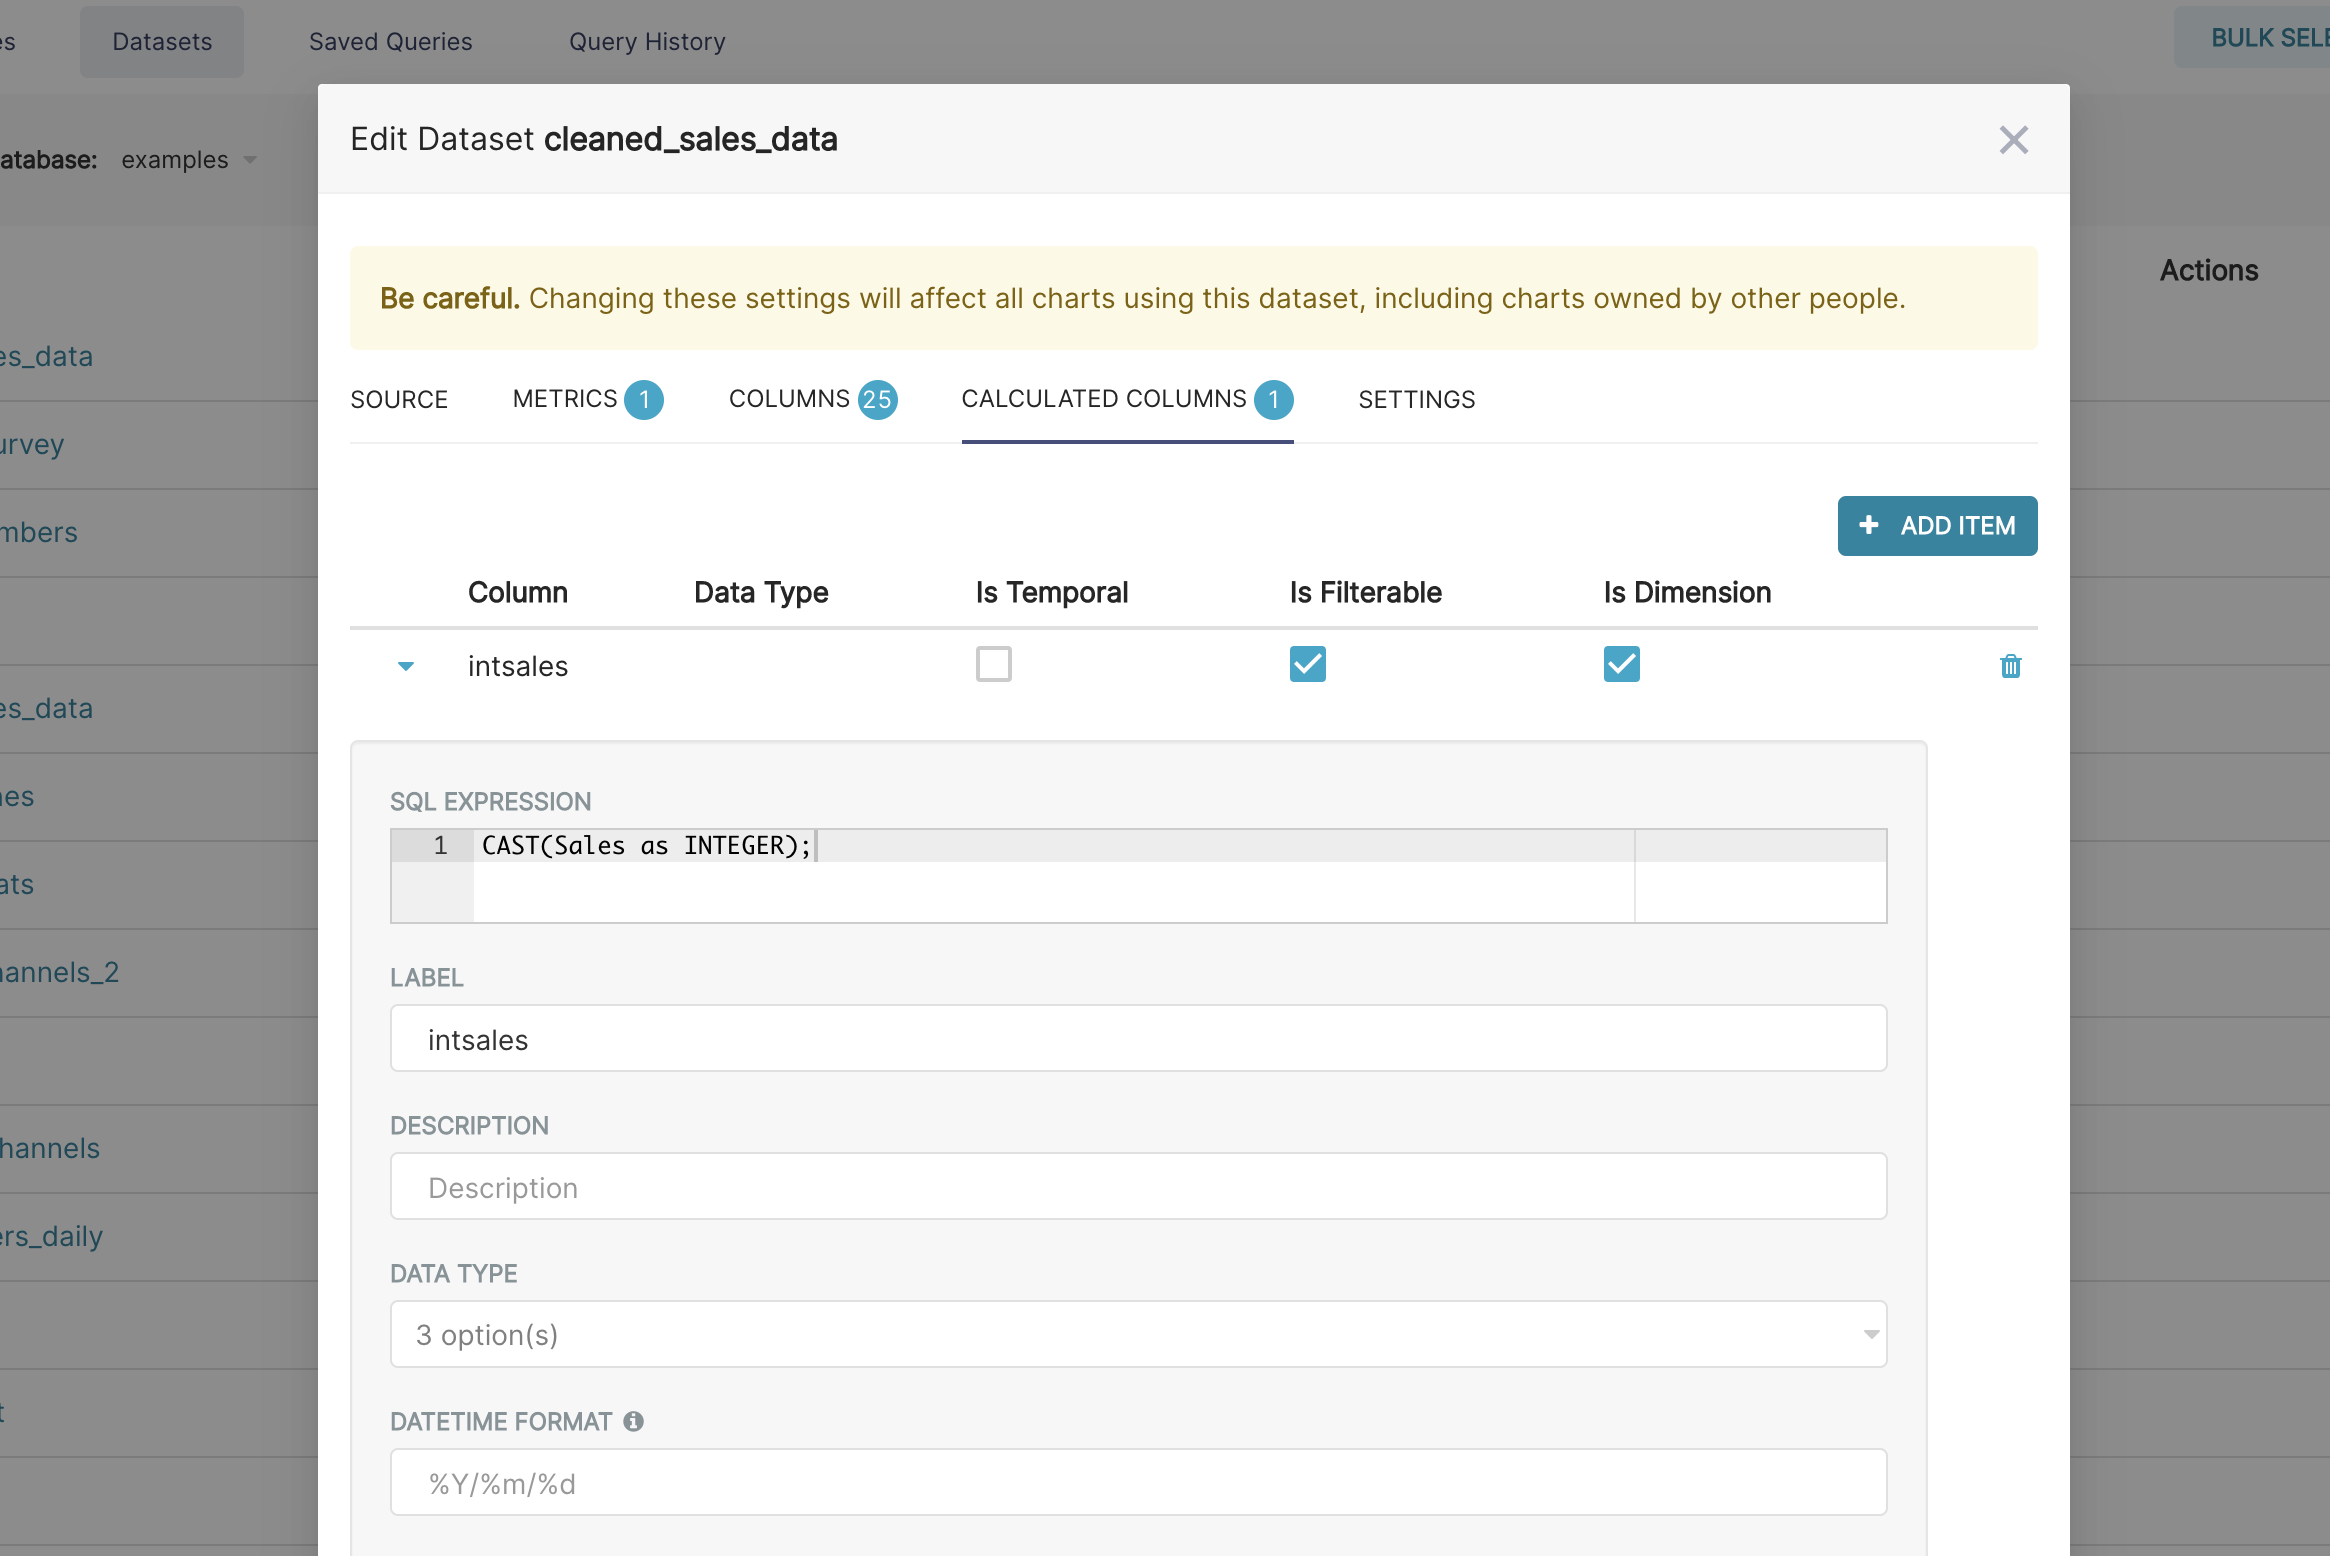
- Virtual calculated columns: you can write SQL queries that
customize the appearance and behavior
of a specific column (e.g.
CAST(recovery_rate) as float). Aggregate functions aren't allowed in calculated columns.