Introduction to Skeyecube™
Skeyecube is the OLAP acceleration engine of Skeye - Data Factory. It sits between your data — in a data warehouse, a database, or a streaming source — and the people querying it, and answers SQL questions about huge datasets in sub-second time by pre-computing results ahead of time instead of scanning raw data on every query.
Typical use cases:
- Powering BI dashboards that need to stay fast as the underlying tables grow
- Giving analysts sub-second, ad-hoc SQL access to datasets that would otherwise require a slow full scan
- Serving the same query fast whether it comes from a BI tool or from a data team running SQL directly
Core concepts
| Concept | What it is |
|---|---|
| Project | An isolated workspace: its own data sources, models, indexes, jobs, and permissions |
| Data source | The tables Skeyecube can query — loaded from a data warehouse, a JDBC-compatible database, or a Kafka stream |
| Model | How a fact table and its lookup tables relate: the joins, dimensions, and measures available for querying |
| Index | Pre-computed results built from a model, used to answer matching queries instantly instead of scanning raw data |
| Segment | An incremental slice of a model's data (for example, one day) that gets built into an index |
| Job | The background task that builds (or rebuilds) a segment's indexes |
Signing in
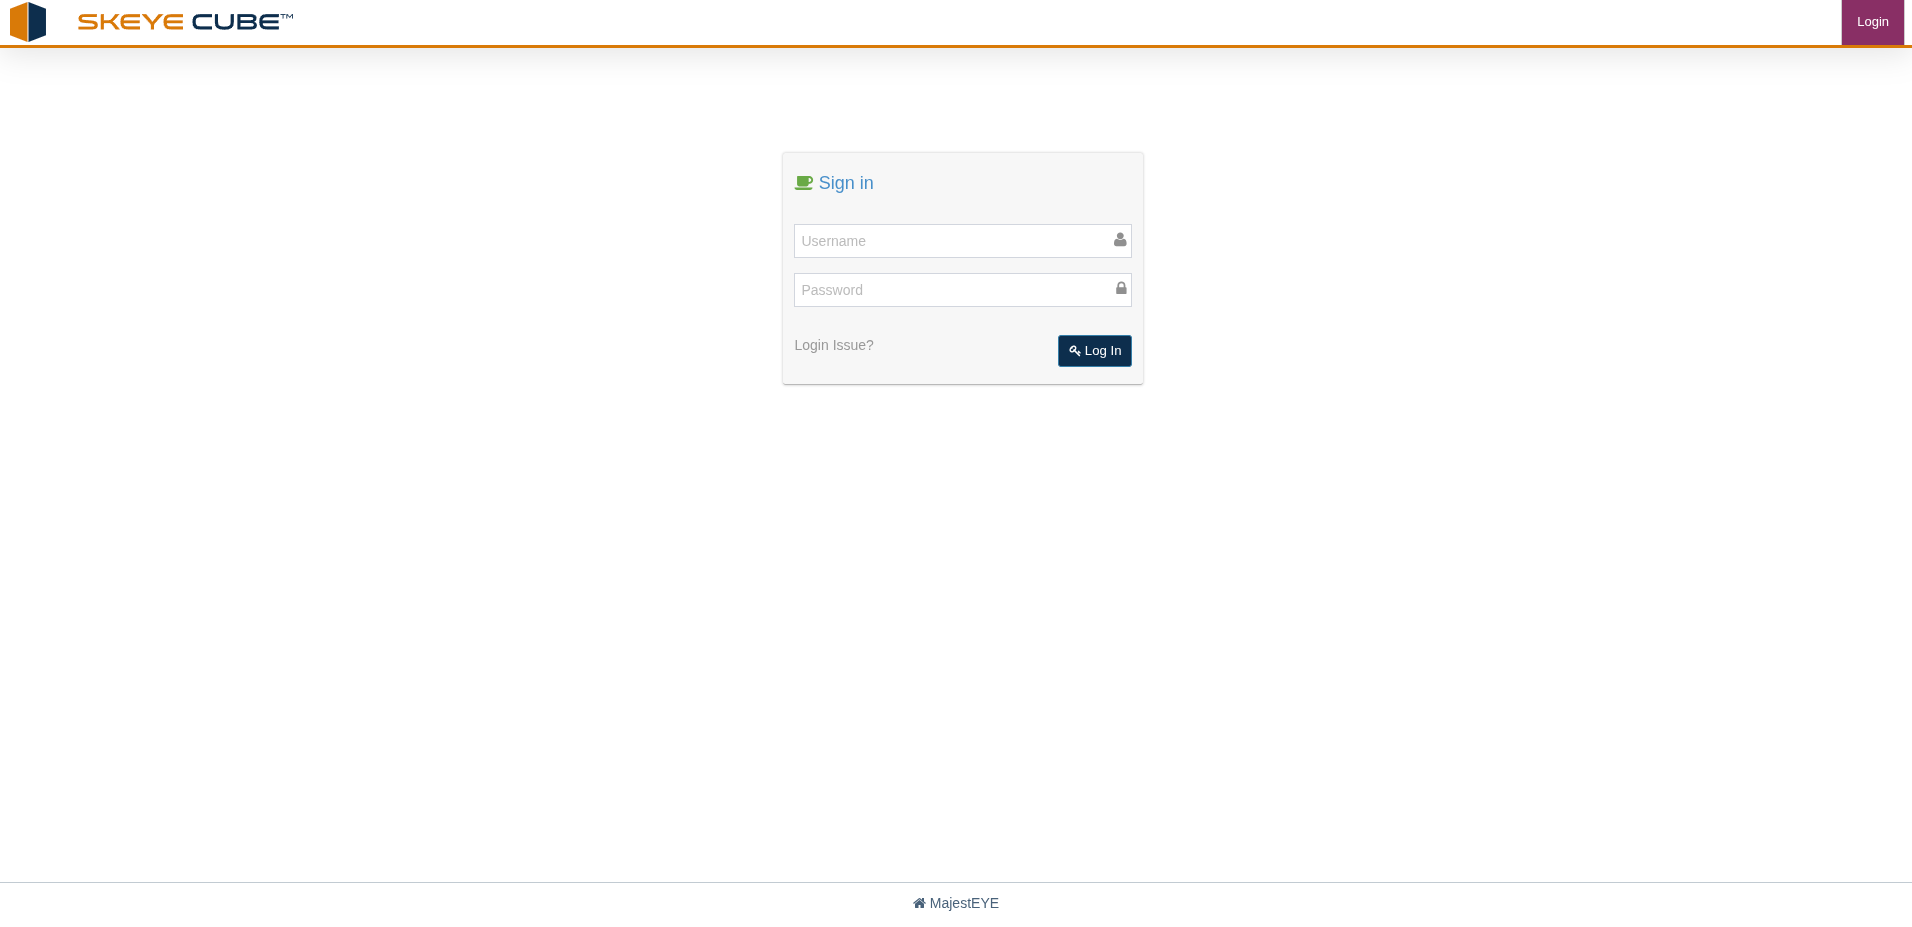
Your Skeyecube account is created by an administrator. Sign in with the username and password they gave you.
Finding your way around
After signing in you land on the Projects list. Every project shows its owner, how many cubes it holds, and when it was created, and you can create a new project from here.
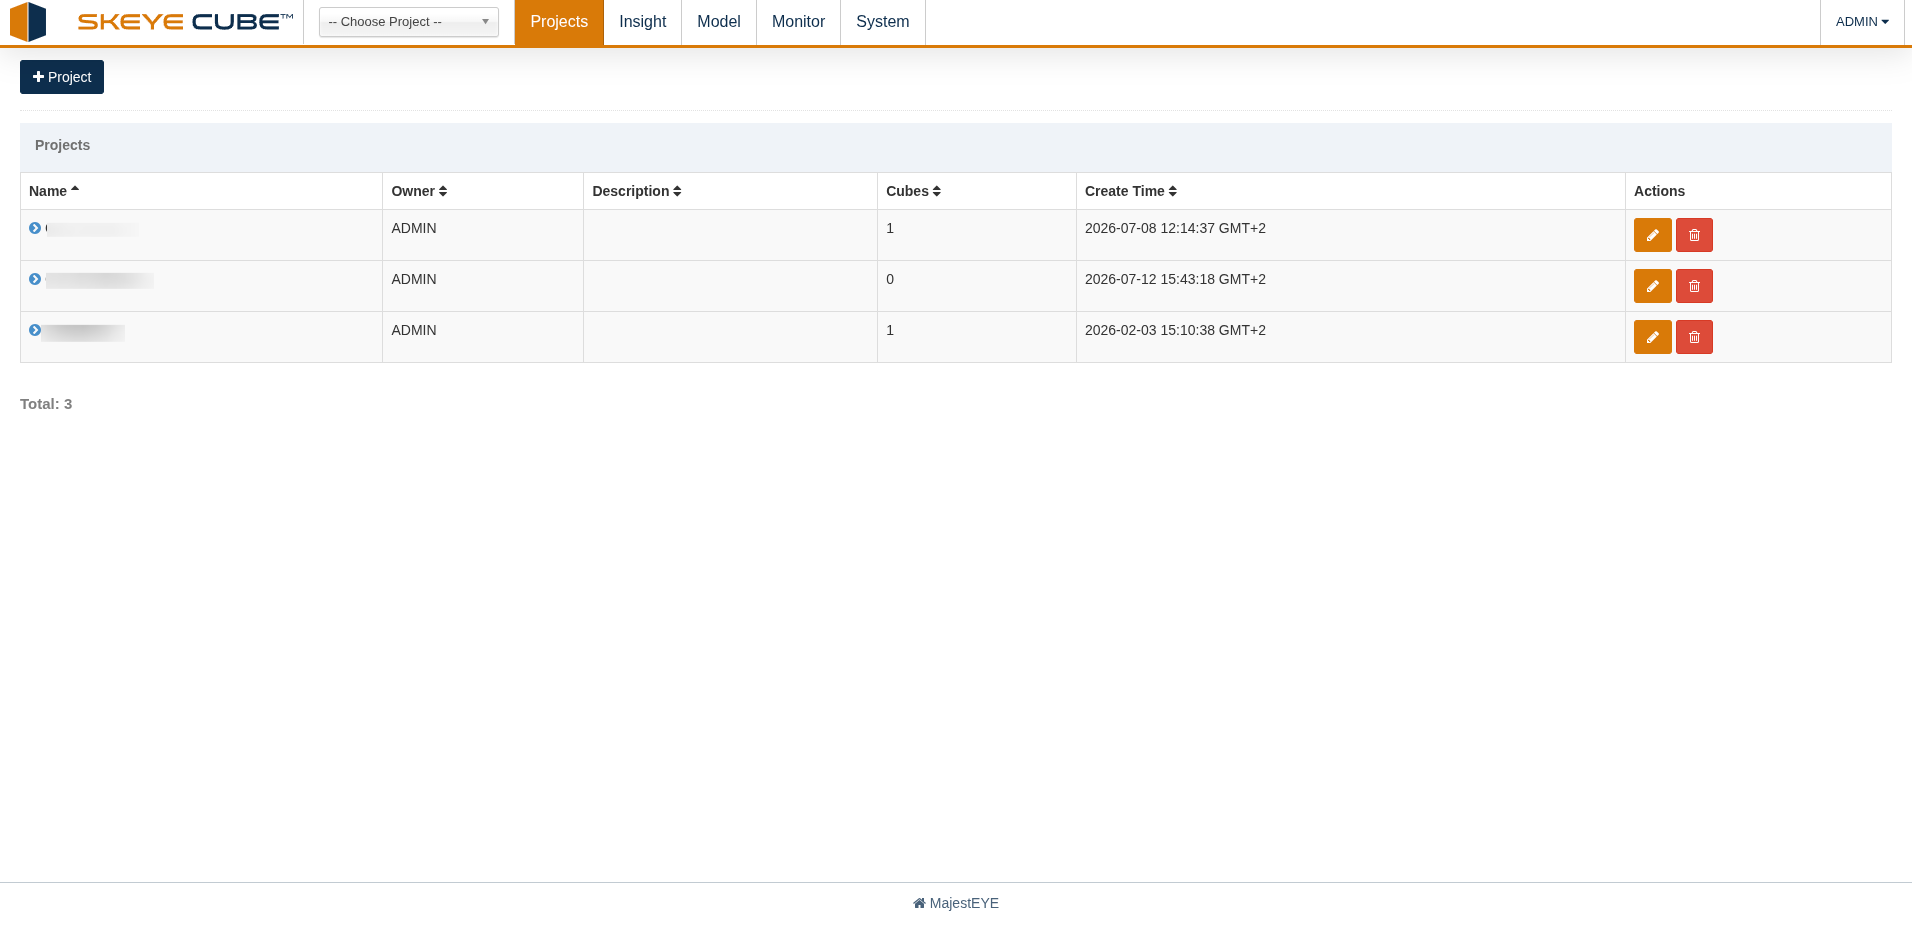
The project selector at the top left sets the project you're working in, and the main menu takes you to each area of the application:
| Menu | What it's for |
|---|---|
| Projects | Create and manage projects |
| Insight | Run SQL against your cubes — see Querying your data |
| Model | Build models and cubes — see Modeling & indexes |
| Monitor | Track build jobs and slow queries |
| System | Configuration, users, and groups — see Administration |
The core workflow
Getting from raw data to a fast dashboard follows the same four steps:
- Connect a data source and pick the tables you want to query — see Modeling & indexes
- Build a model describing how those tables join together, and which columns are dimensions or measures
- Build indexes on that model, so common query patterns are pre-computed
- Query the model — from the built-in SQL editor or from a BI tool — see Querying your data
Where to go next
- Modeling & indexes — connecting data, building models, and choosing what to pre-compute
- Querying your data — the SQL editor, query history, and connecting BI tools
- Projects, users & permissions — organizing work into projects and controlling access