Introduction
What is Skeyeingest™?
Skeyeingest is a design and execution engine that streams data in real time. Use it to route and process data in your data streams.
To define the flow of data, you design a pipeline in Skeingest. A pipeline consists of stages that represent the origin and destination of the pipeline, and any additional processing that you want to perform. After you design the pipeline, you click Start and Skeingest goes to work.
Skeingest processes data when it arrives at the origin and waits quietly when not needed. You can view real-time statistics about your data, inspect data as it passes through the pipeline, or take a close look at a snapshot of data.
How should I use Skeingest?
Use Skeyeingest like a pipe for a data stream. Throughout your enterprise data topology, you have streams of data that you need to move, collect, and process on the way to their destinations. Skeyeingest provides the crucial connection between hops in the stream.
To solve your ingest needs, you can use a single instance to run one or more pipelines. Or you might install a series of instances to stream data across your enterprise data topology.
Logging In and Creating a Pipeline in Skeingest
After you start Skeingest, you can log in and create your first pipeline.
This procedure uses the default settings.
-
To access Skeingest using the UI, enter the following URL in the address bar of your browser:
http://<hostname>:18630/If the default Skeingest port number was changed, then use that number instead.
-
log-in using your provided credentials
-
The default credentials to log in:
admin / admin.If other a custom credentials were provided, please use those instead.
-
-
On the Get Started page, click Create New Pipeline.
-
In the New Pipeline window, enter a name for the pipeline, optionally enter a description, and click Save.
The pipeline canvas appears. The Properties panel displays pipeline properties. For a description of the icons and areas, see Data Collector UI - Edit Mode.
For more information about pipelines, see What is a Pipeline?
For the steps to configure a pipeline, continue with step 3 in Configuring a Pipeline.
Data Collector User Interface
Data Collector provides a web-based user interface (UI) to configure pipelines, preview data, monitor pipelines, and review snapshots of data.
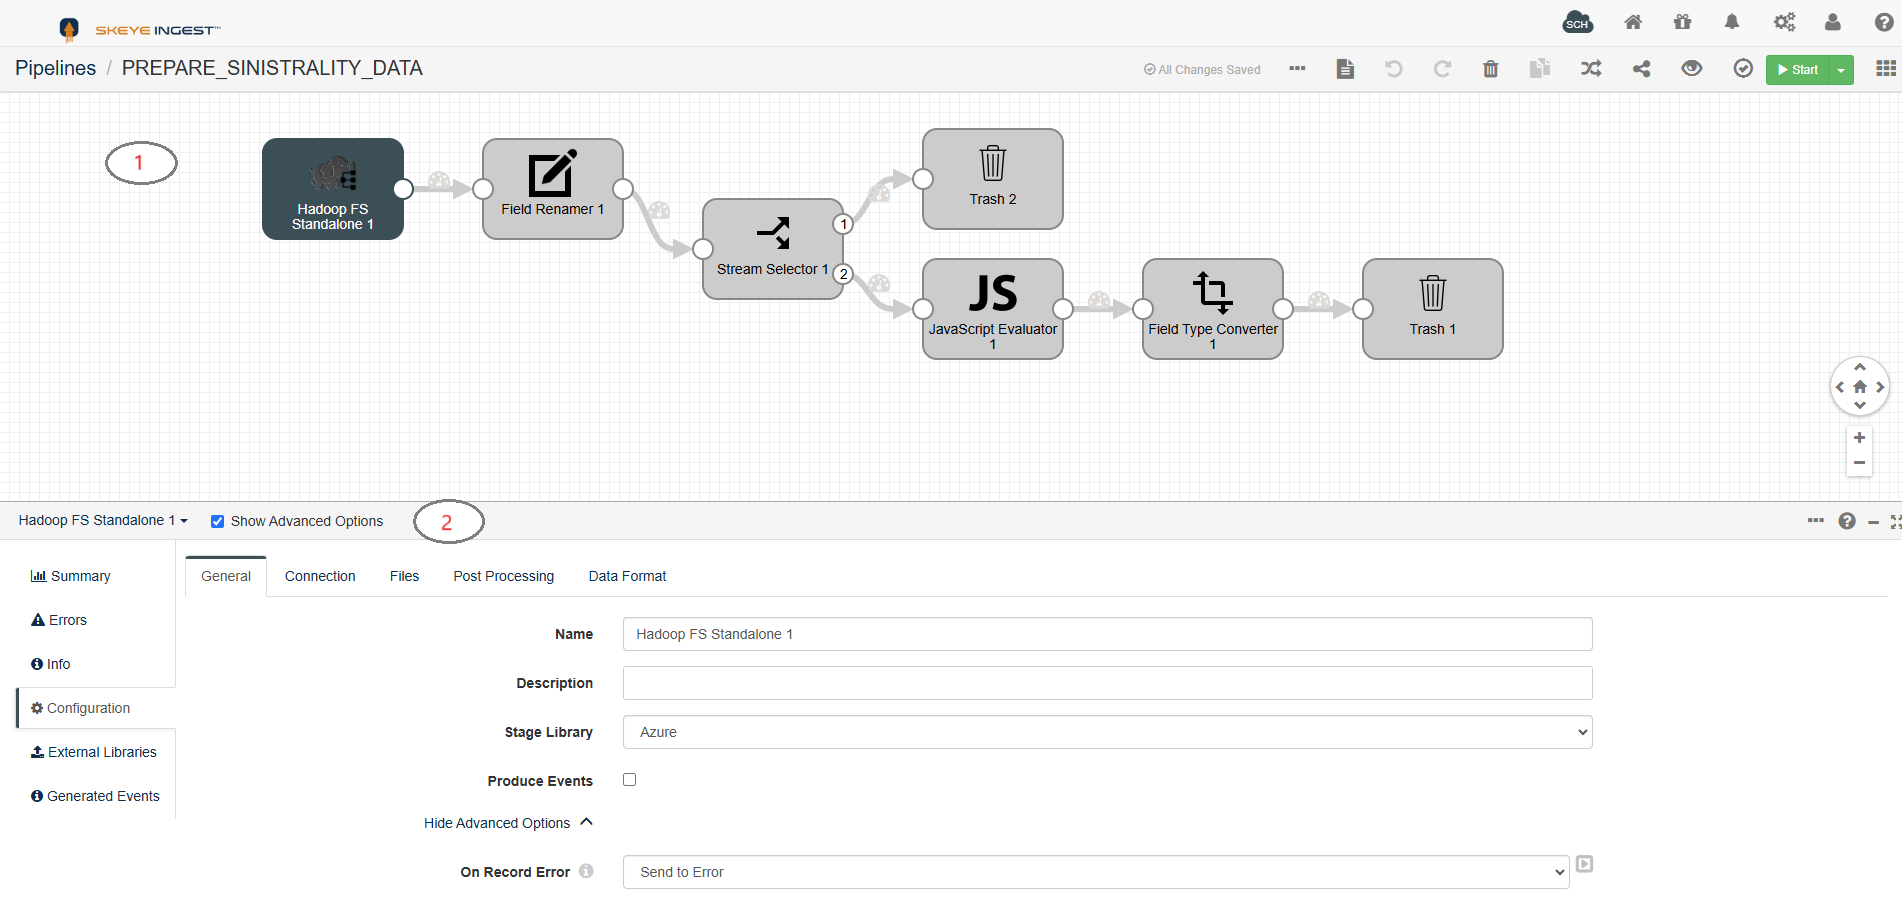
The Data Collector UI includes the following general areas and icons:
| Area/Icon | Name | Description |
|---|---|---|
| 1 | Pipeline canvas | Canvas for configuring, previewing, or monitoring a pipeline. |
| 2 | Properties panel / Preview panel / Monitor panel | When you configure a pipeline, the Properties panel displays the properties of the pipeline or selected stage. You can resize, minimize and maximize the panel.When you preview data, the Preview panel displays the data that enters and exits the selected stage or group of stages. It can also display stage properties and preview configuration. When you monitor a running pipeline, the Monitor panel displays real-time metrics and statistics. Note: Some icons and options might not display. The items that display are based on the task that you are performing and roles assigned to your user account. |
 | SkeyeIngest Control Hub icon | Provides information about SkeyeIngest Control Hub and lets you register this Data Collector with Control Hub. |
 | Home icon | Displays a home page with a list of pipelines and their statuses, allowing you to perform pipeline maintenance and navigate to individual pipelines. |
 | Package Manager icon | Displays the Package Manager which allows you to install additional stage libraries for a core or common Data Collector installation. |
 | Notifications icon | Displays notifications. |
 | Administration icon | Provides access to Data Collector configuration properties, directories, and log. Also allows you to shut down Data Collector. |
 | User icon | Displays the active user and the roles assigned to the user. Also allows you to log out of Data Collector. |
 | Help icon | Provides context-sensitive help based on the information in the panel. Allows you to configure display settings and to specify whether to use a local or hosted version of the help. Provides access to the REST API and the Data Collector version. |
 | Link to a pipeline list | Link to a pipeline list on the Home page. Use to view a list of available pipelines, perform pipeline maintenance like starting or sharing a pipeline, and navigate to individual pipelines. |
 | More icon | Provides additional actions for the pipeline. |
Configuring the Display
You can configure how information in the Data Collector UI displays, such as the online help version, information density in the panel, and the pipeline creation help bar.
-
In the top right corner of the Data Collector UI, click Help > Settings.
-
In the Settings dialog box, you can configure the following options:
Display Setting
Description
Timezone
Display time zone. Used to display dates and times in the Data Collector UI, such as datetime data in data preview or snapshot data.
You can choose between the following options:
- UTC
- The browser time zone, which usually uses the operating system time zone.
- When the Data Collector runs on a different machine, the operating system time zone of the Data Collector machine.
Display Density
Defines the density of the information that displays in the panel.
Help
Defines the help project that Data Collector uses:
- Local help - Uses the help project installed with Data Collector.
- Hosted help - Uses a help project hosted on the SkeyeIngest website. Hosted help contains the latest available documentation. Requires an internet connection.
Default is hosted help. When internet access is not available, Data Collector uses local help.
Both help projects provide context-sensitive help.
Hide Missing Stage Libraries in Stage Library Panel
Hides Data Collector stages that are not installed in the stage library panel.
When cleared, the stage library panel displays all Data Collector stages, instead of only the installed stages. Stages that are not installed appear disabled, or greyed out.
Hide Pipeline Creation Help Bar
Hides the pipeline configuration help bar that displays by default when a pipeline is incomplete.
Hide REST Response Menu
Hides the REST Response menu so you cannot request REST API response information.
Run preview in background to display available fields
Runs preview in the background to display lists of available fields and the Select Fields with Preview Data option as you configure pipeline and stage properties.
Running preview in the background can freeze the browser if the preview results in a large record. To resolve this issue, clear the property.
Wrap long lines in properties
Wraps long lines of text that you enter in properties. For example, you might enter a long line of text when you configure the preconditions for a stage.
When cleared, displays long lines of text with a scroll bar.
Data Collector UI - Pipelines on the Home Page
Data Collector displays a list of all available pipelines and related information on the Home page. You can select a category of pipelines, such as Running Pipelines, to view a subset of all available pipelines.
Pipelines display on the Home page when you or your user group has read permission on the pipeline or when you created the pipeline.
View pipelines on the Home page to perform pipeline maintenance, such as copying or sharing a pipeline. You can access the Home page when you click the Home icon () in the top-level set of icons on the page. You can also access the Home page by clicking the Pipelines link in the pipeline path when you are configuring or monitoring a pipeline.
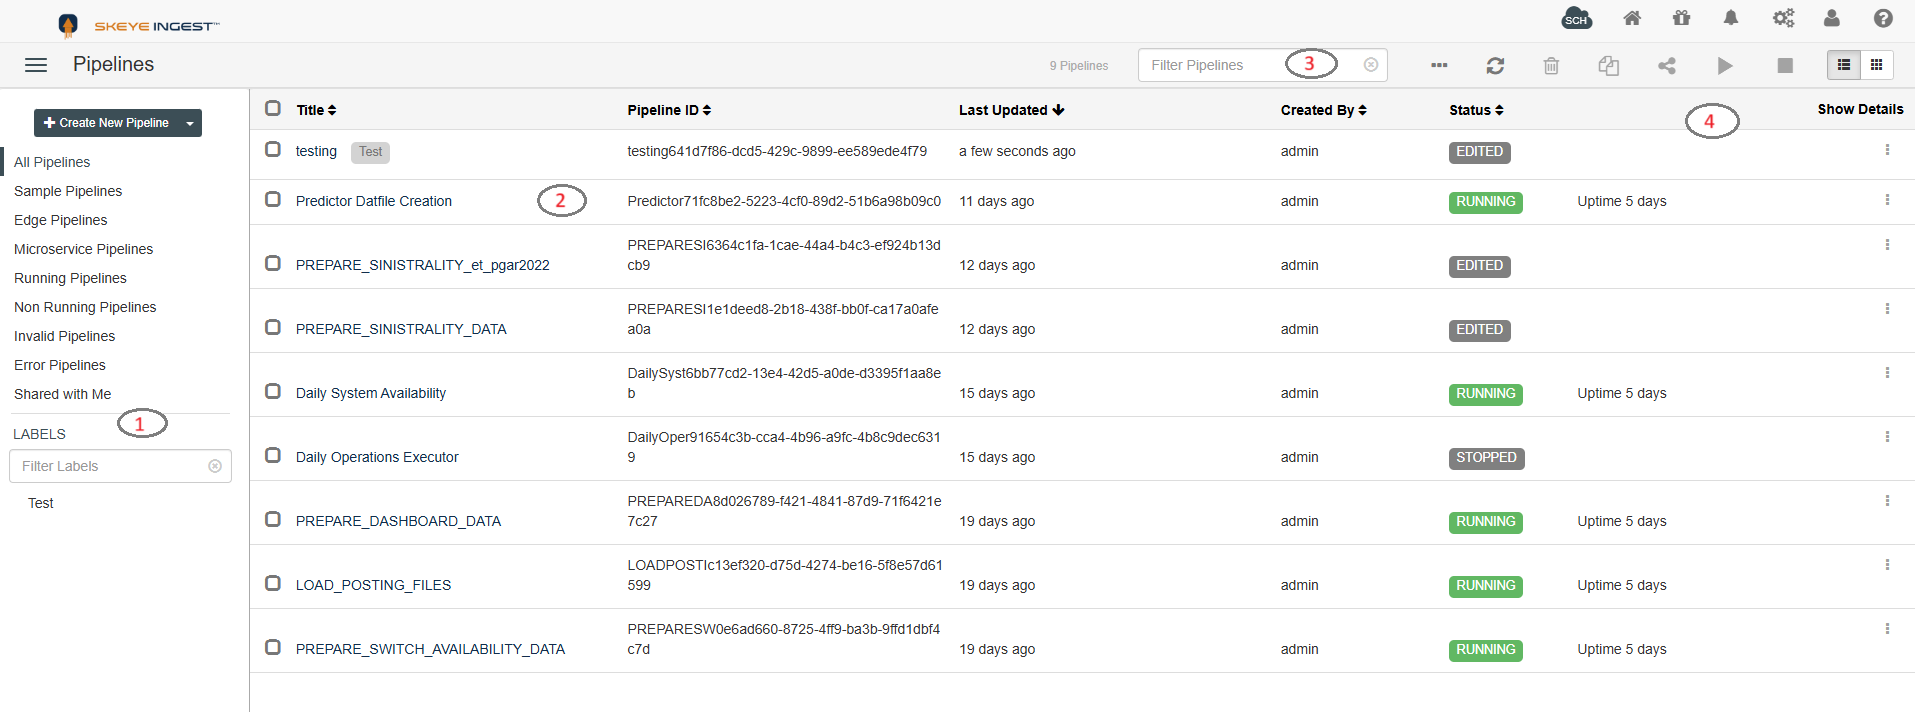
The following image shows the Data Collector Home page:
| Area/Icon | Name | Description |
|---|---|---|
| 1 | Pipeline library | Library of pipelines associated with this Data Collector. The library lists: - Pipeline categories - Select a pipeline category to filter pipelines in the list by category. For example, you can filter by all running pipelines or by all edge pipelines. - Pipeline labels - Select a pipeline label to filter pipelines in the list by label. |
| 2 | Pipeline list | Allows you to select one or more pipelines and then perform an action on the pipelines, such as starting, stopping, or exporting the pipelines. |
| 3 | Filter field | Allows you to filter for pipelines by name. |
| 4 | Show Details | Displays details about error messages and alert texts for each pipeline in the list. |
| SkeyeIngest Control Hub icon | Provides information about SkeyeIngest Control Hub and lets you register this Data Collector with Control Hub. |
| Home icon | Displays a home page with a list of pipelines and their statuses, allowing you to perform pipeline maintenance and navigate to individual pipelines. |
| Package Manager icon | Displays the Package Manager which allows you to install additional stage libraries for a core or common Data Collector installation. |
| Notifications icon | Displays notifications. |
| Administration icon | Provides access to Data Collector configuration properties, directories, and log. Also allows you to shut down Data Collector. |
| User icon | Displays the active user and the roles assigned to the user. Also allows you to log out of Data Collector. |
| Help icon | Provides context-sensitive help based on the information in the panel. Allows you to configure display settings and to specify whether to use a local or hosted version of the help.Provides access to the REST API and the Data Collector version. |
 | Toggle Library Pane icon | Icon to show or hide the pipeline library. |
| More icon | Provides additional actions for pipelines. Use to reset origins for pipelines, add labels to pipelines, export pipelines, and display pipeline IDs. |
 | Refresh icon | Refreshes the pipeline list. |
 | Delete icon | Deletes the selected pipelines. |
 | Duplicate icon | Duplicates the selected pipelines. |
 | Share icon | Shares the pipeline with users and groups. Use to configure pipeline permissions. |
 | Start icon | Starts the selected pipelines. |
 | Stop icon | Stops the selected pipelines. |
 | List View icon | Displays the pipelines in a list. |
 | Grid View icon | Displays the pipelines in a grid. |
 | Error icon | Indicates that the pipeline has errors. |
 | Actions icon | Allows you to import, export, duplicate, or delete a single pipeline. |
For information about configuring pipelines, see Data Collector UI - Edit Mode.
For information about data preview options, see Data Collector UI - Preview Mode.
For information about pipeline monitoring options, see Data Collector UI - Monitor Mode.